NOAA Storm Prediction Center

Wednesday, 27 August 2014

Temperature Trends in Canada and in Europe


                                                                                 Courtesy  of WeatherBell

The image above shows quite an impressive 2m temperature analysis across Europe for the last 7 days - as you can see, much of the continent was enveloped by strongly negative anomalies, except for the extreme SE parts of Turkey. Parts of Western and Central Europe have experienced anywhere from 3 °C to 6 °C lower temperatures than on average, which is surely not a welcoming sight for everyone during the summer months! 

                                                                                  Courtesy of WeatherBell
Here at home, we've seen our own share of ups and downs over the last couple of weeks, especially for those in the prairies and further W into BC. The temperature analysis across Canada over the last 7 days were quite impressive as well - there were strongly negative anomalies across the three prairie provinces including NW Ontario, while the E part of the country including the maritime provinces saw positive anomalies. The largest deviation from average temperatures was in Southern Saskatchewan and Manitoba, who experienced 5 °C to 7 °C lower temperatures than on average! The exact opposite was seen in the province of Quebec, where temperatures observed were 5 -7 °C warmer than on average. 


Most of the areas along the BC coast and Northern parts of Nunavut also saw positive temperature anomalies - with temperatures 1 to 3 °C above average. 


Friday, 8 August 2014

Iselle weakens to a Tropical Storm as it makes landfall on Hawaii's Big Island


Iselle made landfall on Hawaii's Big Island  as a Tropical Storm at 2:30 a.m. HST. Even though it did not make landfall as a Cat. 1 Hurricane, it is only the second Tropical Storm on record to make landfall on the Big Island. The first Tropical Storm to hit the Big Island was in 1958. Therefore Iselle is still a rare, if not historical, Tropical Storm that's one for the books. In the IR image above, Iselle showed signs of weakening on its approach indicated by the dissipation of colder cloud tops. However, orographic lift has produced high cloud tops (colder than -80 C ), shown in the dark reds near the end of the animation. This has led to heavy amounts of rain on the lee side (east) of the mountains and the issue of flood warnings.

                Courtesy of Brian McNoldy, Univ. of Miami, Rosenstiel School

Above is a sped up radar animation of Iselle making landfall on the Big Island in Hawaii. The outer rain bands and a defined eyewall can be seen just before landfall.

Wednesday, 6 August 2014

Hurricane Iselle and Julio set their sights on Hawaii


Hurricane Iselle and Julio in the eastern Pacific Ocean, are currently forecast to impact Hawaii towards the end of the work week. Above is the latest 2 km natural colour imagery of Julio, currently a category 1 hurricane.

The images below shows the enhanced infrared IR VIIRS of Hurricane Iselle (above) and Julio (below).  These images can be used to determine hurricane intensification or weakening. The colder cloud tops between -70 and -80 C seen for hurricane Julio have been correlated with storm intensification. This is was ultimately led to its development into the fifth hurricane of the eastern Pacific season this year. In Iselle's case, the cloud tops ahead of the storm are warmer, showing weaker vertical development, and storm weakening since its Category 4 status on August 04, 2014.


Hurricane Iselle has shown signs of weakening on satellite imagery, and is going down the path to being downgraded to a tropical storm by the end of the day. A large area of dry air ahead of Iselle is the culprit for rapid weakening of a hurricane due to dry air entrainment. As well, as Iselle tracks eastwards towards Hawaii, strong gusty winds and heavy rains can also weaken out tropical systems. Based on current imagery, this large loss of moisture will most likely result in quick dissipation of Iselle as it nears the Hawaii islands.

Below is the water vapour image for Iselle and the Storm Relative 16 km Geostationary water vapour image for both Iselle and Julio respectively. Notice the dry air ahead of Hurricane Iselle, but a moisture environment ahead of Julio. 


Julio can be seen in the Total Precipitable Water (TPW) imagery quite nicely as well, right behind the heels of Iselle. With Hurricane Julio's current west-northwestward track, it will not have to deal with as much dry air as Iselle. However, Julio is currently forecast to track more northward where cooler ocean water (and relatively stronger wind shear) are present, which could limit its strength during its passage north of the Hawaii islands. 


Below is Iselle's and Julio's track respectively.


Below are the past and future forecasted tracks for Iselle and Julio respectively. As of this morning, Iselle was a category 2 hurricane while Julio obtained category 1 hurricane status. The first image shows the colour enhanced IR image of hurricane Iselle overlaid with the Surface Adjusted Satellite Winds, displayed by the wind barbs. 


The second image shows the IR image of Iselle (left) and Julio (right) today at 1330 UTC. 


You can also learn more about Hurricane Iselle's and Julio's progression in the eastern Pacific at:

   ---------------------------------Update (Aug. 07, 2014)----------------------------------

These are the current watches and warnings in place for Hawaii. The last time a hurricane warning was issued for Hawaii was 22 years ago, when hurricane Iniki hit Kauai as a Category 4! It looks like the greatest impact from Hurricane Iselle will be felt on Hawaii's Big Island, as it makes landfall later tonight. If Iselle does make landfall on the Big Island as a Category 1 hurricane, this will be the first time in recorded history!


On a side note, Typhoon Genevieve has been upgraded to a Super Typhoon as of 5 a.m. EDT Thursday, with maximum sustained winds of 150 mph. This is in equivalence to the wind speeds of a Category 5 hurricane. It currently does not pose a risk to land. 

Below is the 1 km visible satellite from MODIS/AVHRR of Super Typhoon Genevieve as well as its projected path and  cone of uncertainty outlined in  yellow  from the CIMSS Tropical Cyclones site taken at 1332 UTC.


Tuesday, 29 July 2014

Outlook on Wednesday's Possible Severe Weather Outbreak in Europe

A possible severe weather outbreak in parts of Europe has caught my eye, so I thought I would write a brief discussion on what to expect. Below is the surface pressure map from Met Office for 12Z tomorrow, indicating the surface low pressure and frontal boundaries.

The Adriatic Sea and its surrounding areas are the most likely to experience the largest impacts from this outbreak. All types of severe weather can be expected, however locally heavy/excessive rainfall will be the greatest threat due to the slow moving nature of an upper level low.


A powerful upper level low will be moving across the central Mediterranean and serve as a focus for more robust severe weather. Another trough will be pushing east across NW. Europe with an associated frontal boundary from central Scandinavia into central Europe. A short-wave will move from E. Scandinavia into NW. Russia.


I'm looking at a HIGHER Risk for coastal areas of the Adriatic sea inland into western Balkans and into parts of N. Italy, with the threat for excessive rainfall, tornadoes/waterspouts and to a lesser extent for severe winds and large hail. It appears likely that a severe weather outbreak will occur on Wednesday and locally dangerous flooding conditions are expected. As the upper low makes progress further SE into the central Mediterranean, widespread storms and clusters could develop/maintain themselves along the SE-wards moving cold front across E. Adriatic sea onshore onto the mountain range. 

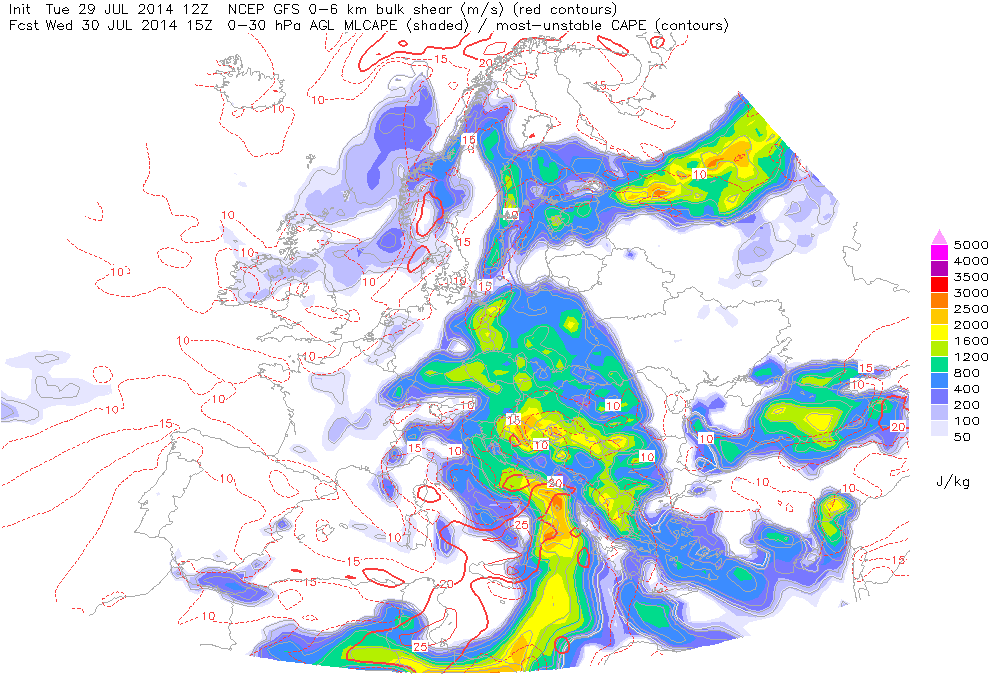
Strong QG forcing combined with a highly unstable airmass: 2000-2500 J/kg of CAPE and moderately strong 0-6 km shear: 20-25 kts within a persistently strong southerly LLJ should result in organized severe storms where a serious flash flood risk will exist due to combined strong orographic and convective rainfall. Further north towards N Italy, a stalled frontal boundary should act as a trigger for the development and  persistence of clusters and therefore high amounts of rainfall are expected as well.


I'm also looking at a MODERATE Risk for E. Germany, the Czech Republic, W. Poland into the Baltic sea and SE. Sweden with the threat for mainly excessive rainfall. An eastwards progressing slow moving frontal boundary should result in widespread and mostly multi-cell storms in a strongly unstable but weakly sheared environment: 1000-1500 J/kg of CAPE with less than 10 kts of 0-6 km wind shear. As well, the Boundary Layer (BL) moisture is showing mixing ratios between 12 and 14 g/kg and dewpoints between 17 and 20 degrees C, making the airmass rich in moisture during cell development. 


Below are the ESTOFEX GFS model maps, the WRF 13 km Europe model, and MeteoNetwork GFS models that illustrate tomorrow's severe potential.  A couple of things to note is the strong  southerly LLJ of 15-20 kts, which will be providing large amounts of moisture, as shown below. We can also see that for Central Europe and for the eastern parts of Germany, the upper level winds are weak, which will lead in cell training and therefore the flood potential. The reason I did not emphasize as largely on the tornado threat is due to the lack of 0-3 km Storm Relative Helicity (SRH) for parts of Central Europe. However, a tornado/waterspout cannot be ruled out in Northern parts of Italy, were 0-3 km SRH values are exceeding the 200 m2/s2 mark.